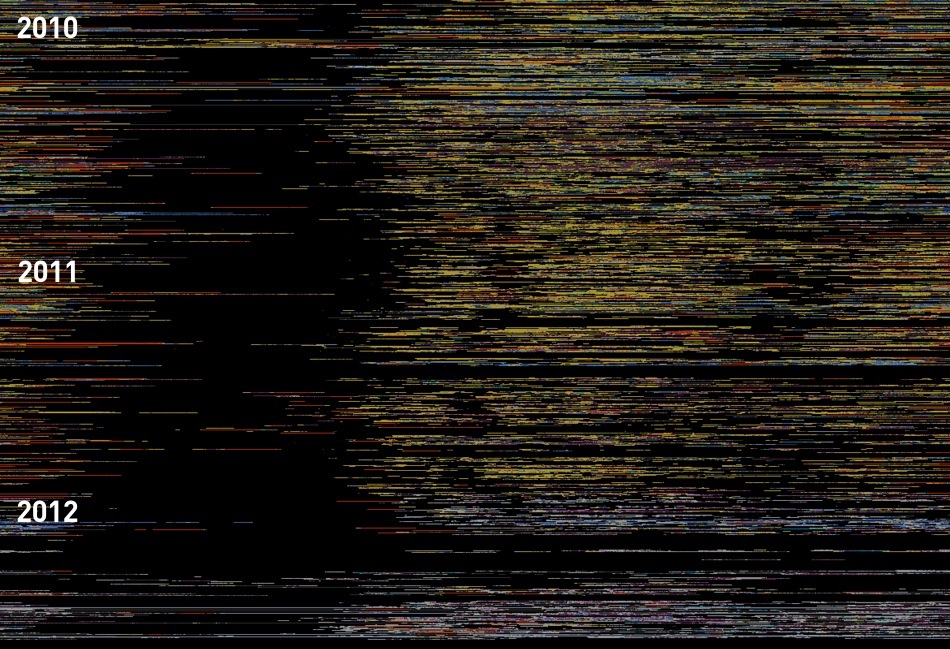
Thanks to BoingBoing, I came across this website today that visualizes computer usage based on the the most foreground app running at the given moment.
It's very similar to the pattern's I'm generating on my WhatColorIsTheSky.com project. Over time (and quite accidentally), the patterns show how the day/night cycle changes with the seasons.
No comments:
Post a Comment